The quadrant of doom and hamstring injuries: sexy but too easy?
Buchheit M., Avrillon S., Simpson B., Lacome M., Guilhem G. The quadrant of doom and hamstring injuries: sexy but too easy? Sport Performance & Science Reports, 2019, June, #63, V1
Full SPSR text here
or the newly published version in the football medicine & performance journal
This paper was submitted to a peer-reviewed journal in May 2018. Within 3 months it received 7 independent reviews from 7 different researchers – as a matter of fact, the overall amount of comments (especially in relation to the length of this short manuscript) was ridiculous. Also, one of the reviewers suggested that the manuscript was not worth publishing for the simple reason that “the content could rather be discussed by email between colleagues”!? This comment was difficult to understand, as we strongly believe (and thankfully, other reviewers did so) in the need for publicly discussing the limitation of (our) scientific endeavours in the hope of improving them. Our desire, here, is nothing more than trying to contribute positively to the debate regarding hamstring injury risk factors. As a consequence, and while we were invited to revise the paper, we gave up with this journal and decided not to resubmit a revised manuscript. We still took the time to integrate the majority of the relevant comments (thank you) to the version you are now about to read.
Key Points
- The idea behind the “quadrant of doom” is evidence-based and sensible, and the highly practical aspect of those muscle strength and architecture measures make the approach very appealing for practitioners.
- However, the likely importance of body mass should not be overlooked when monitoring Nordbord performance, which may limit the relevance of the “quadrant of doom” as currently provided with absolute strength values.
- Similarly, since body size may also directly affect muscles length, it’s intuitive to normalize the fascicles length used in the “quadrant of doom” for their relative muscle length.
- The measurement of fascicle length with the 2D static image technique likely overestimates fascicle length when compared to extended field of view techniques, thereby affecting the subsequent muscle function and injury risk estimates.
- Since the relationship between fascicle length, muscle strength and strain during active lengthening is probably muscle head- and player-dependent, the use of a single measure (i.e., fascicle length) on a single muscle (e.g., biceps femoris long head, BFlh) to assess the overall injury risk of the hamstring group remains likely limited.
- The “quadrant of doom’’ being a two-dimensional representation of hamstring injury risk factors only, others extremely important risk factors such as age and previous injury history can’t be integrated into the ‘picture’; this can bias the risk evaluation.
- Although sound in theory, whether the above-mentioned theoretical arguments substantially improve the prognostic value of the “quadrant of doom” when it comes to predicting injuries remains to be investigated with real data. More research is still warranted to both improve 1) our understanding and use of Nordbord performance in relation to body mass, and 2) the prognostic value of isolated muscle properties in relation to the overall hamstring group.

Figure 1. The need for adjusting physical performance for body mass (and likely size) is evident for practitioners when it comes to comparing players of different body dimensions (i.e. >30kg of difference in body mass). Photo C.Gavellle/PSG.

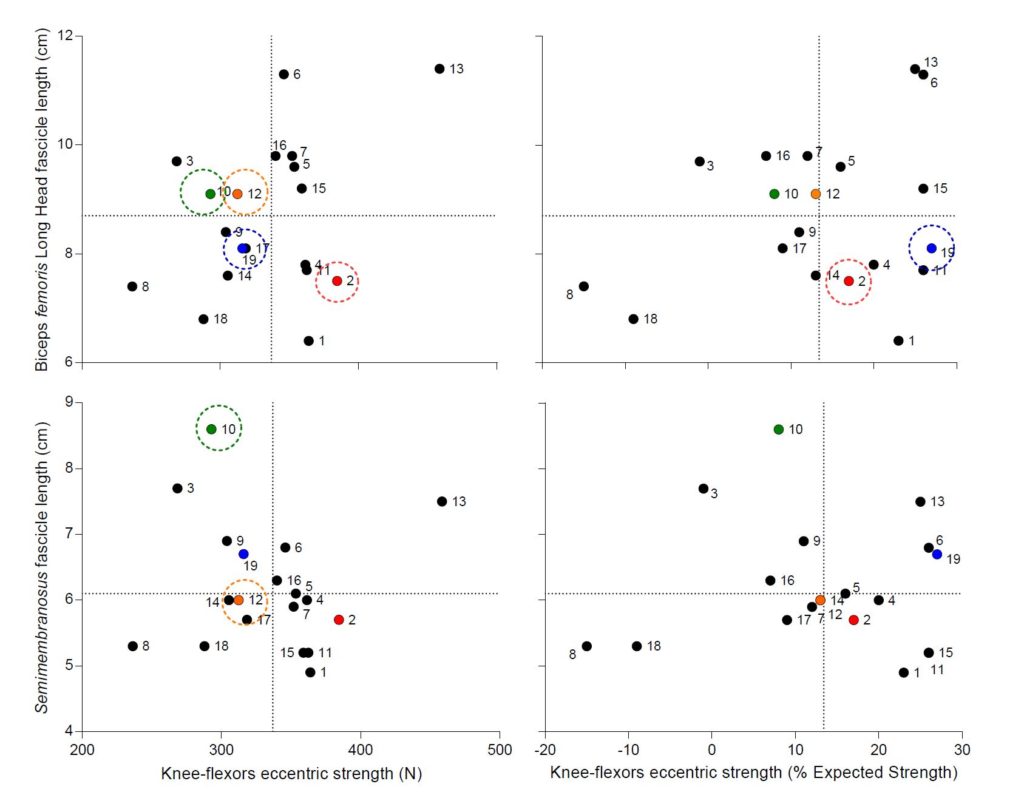
Figure 2. In-season values of elite U19 soccer players (17.5±0.7 yrs, 175.7±5.0 cm and 64.7±4.9 kg, training 10 hrs a week) for biceps femoris long head (upper panels, BFlh, y-axis) and semimembranosus (lower panels, y-axis) fascicle length and eccentric knee flexor strength (Nordbord performance, x-axis) expressed in absolute (left panels) and relative to body mass (right panels). The eccentric knee-flexor strength testing was performed as previously described (10). As between-leg differences were beyond the scope of the current study, the average strength of both legs was used for analysis (10). The data relative to body mass are expressed as the % difference vs. body-mass expected value using the following equation: eccentric strength (N) = 4 × BM (kg) + 26.1 (10). While we agree that the adjustment of Nordbord performance for BM may be optimal using population-specific equations (10), we chose to use this generic equation since this is what most practitioners would use initially, before getting their own equation. We also believe that using a group-specific equation would not change the main message of the present example. Muscle fascicles were imaged using a 42-mm linear probe (2–10 MHz, SL10-2, Supersonic Imagine, Aix-en-Provence, France) coupled with an ultrasound scanner (Aixplorer V11, Supersonic Imagine, Aix-en-Provence, France) (18). Given that the field-of-view of the probe was too narrow to image an entire fascicle, we used an inbuilt panoramic mode of the ultrasound device. This mode uses an algorithm that fits series of images, allowing scanning of entire fascicles within one continuous scan. This technique enabled us to avoid any extrapolation of non-visible parts of the muscle and improved measurement accuracy (21). We used this scan to measure the length of two fascicles per muscle. The two values were then averaged to obtain a representative value for the whole muscle. Reliability assessment in our laboratory (n= 12, test-retest within 24h) showed small and trivial day-to-day variations in BFlh length (typical error: 0.38±0.15 cm, 4.9±2.0%). Dotted lines for strength are based on recommend thresholds (1). Because of the difference in methods used to measure BFlh length in comparison with the literature, the dotted line was based on the median value of the current group (i.e., 8.7 cm).


