Monitoring changes in Jump and Sprint Performance: Best or Average values?
H. Al Haddad, BM. Simpson and M. Buchheit. Monitoring changes in Jump and Sprint Performance: Best or Average values? IJSPP, In press
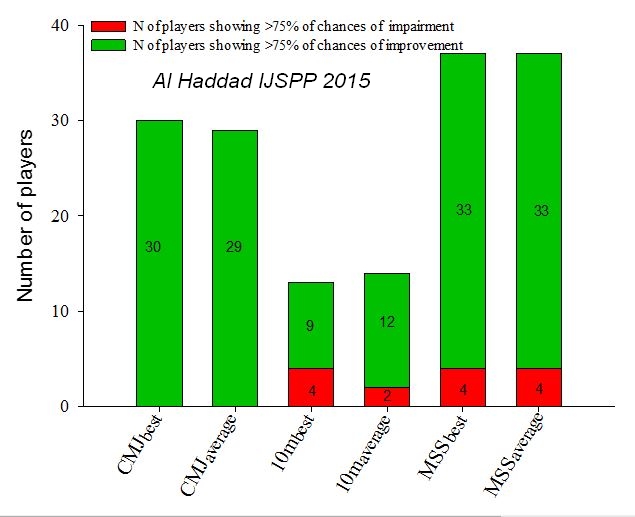 Figure 1. Number of players showing at least a likely (>75% of chances) improvement or impairment in performance when considering either the best (CMJbest) or the average (CMJaverage) counter movement jump, the best (10mbest) and average (10maverage) 10-m sprint time, or the best (MSSbest) and average (MSSaverage) maximal sprinting speed.
In this study we compared different approaches to monitor changes in jump and sprint performance while using either the best or the average performance of repeated trials. One hundred and two highly-trained young footballers (U13 to U17) performed, in two different testing sessions separated by four months, 3 countermovement jumps (total player files = 87) and 2 sprints (n = 98) over 40 m with 10-m splits to assess acceleration (first 10 m) and maximal sprinting speed (best split, MSS). Standardized group-average changes between the two testing periods and the typical error (TE) were calculated and compared for each method. The likelihood of substantial changes in performance for each individual player was also calculated. There was a small increase in jump performance (+6.1% for best and +7% for average performance). While 10-m time was likely unchanged (~+1.2% for both best and average performance), MSS showed likely small improvements (~+2.0% for both best and average performance). The TE for jumping performance was 4.8% (90% confidence limits, 4.3;5.6) and 4.3% (3.8;5.0) using either best or average values, respectively; 1.8% (1.6;2.1) and 1.7% (1.5;1.9) for 10-m time, and 2.0% (1.8;2.3) and 2.0% (1.8;2.3) for MSS. The standardized differences between TE were likely unclear or trivial for all comparisons (e.g., 10-m, 0.01 (-0.09;0.10)). The number of players showing a likely increase/decrease in performance was: 30/0 and 29/0 for best and for average jump performances, 9/4 and 12/2 for 10-m times and finally, 33/4 and 33/4 for MSS. In conclusion, the two monitoring approaches are likely to provide similar outcomes.
Key words: testing, coefficient of variation, sensitivity.